Clustering of Lyman Break Galaxies
Lyman break galaxies show clustering even at a redshift of z~3. At
z=3 the universe is ~ 15% of its current age. Can structure grow that
fast?
From Steidel etal 1998 (ApJ,. 492, 428):

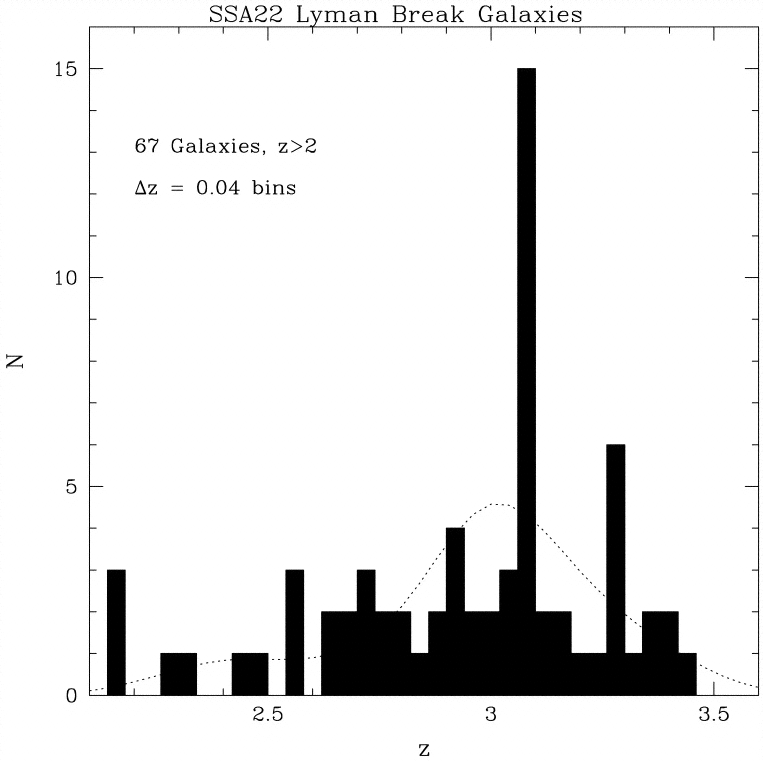
FIG. 1. Redshift
histogram of the 67 color-selected objects with z > 2 that
have been
confirmed spectroscopically in
an 8
 7
by
17
 6
strip. The dotted curve represents the smoothed redshift selection
function
obtained to date for our overall survey, normalized so as to have the
same
number of total galaxies as the SSA 22 sample. Approximately one-third
of
the confirmed redshifts are from the SSA 22 fields. The binning here is
arbitrary; the formal boundaries of any "features" in the redshift
distribution used for analysis were obtained using the method described
in §
3 and in the Appendix.
In order to have that level of clustering, we must have a very
high bias factor (remember: bias is the constrast factor between dark
matter and galaxies):

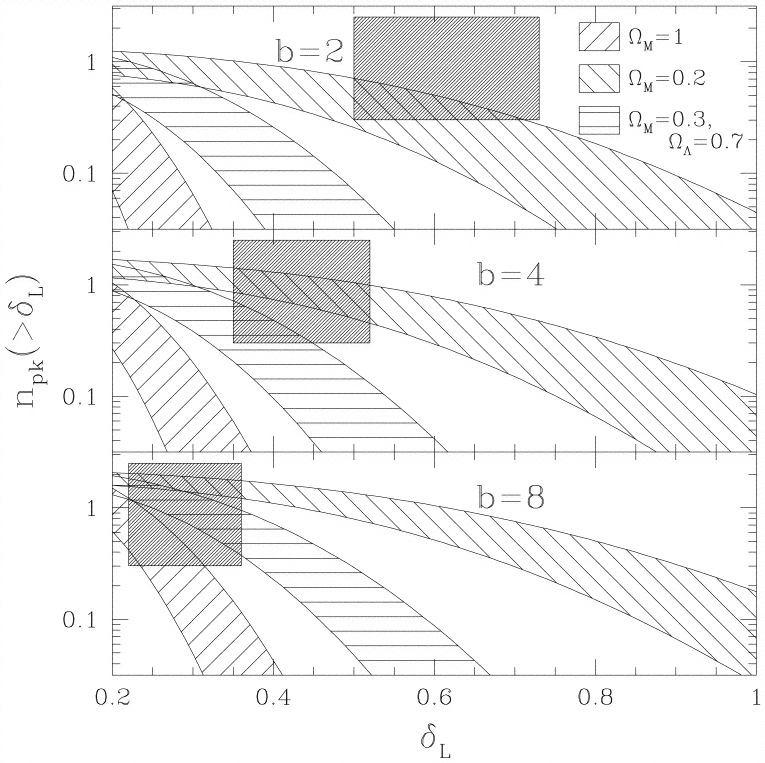
FIG. 4. Reconciling
the observed galaxy overdensity with various cosmological scenarios.
The
smooth curves show the expected number of peaks in this field with
linear
overdensity greater
than
  L.
The shaded boxes show the approximate peak height and number density
deduced from our observations. The actual box position is slightly
different for each of the cosmologies, but this difference is
insignificant
for our purposes. If a curve passes through the box, then the
corresponding
parameter values are at least roughly consistent with the existence of
the
spike in the redshift histogram. The x range of the box is a
68%
confidence interval that takes into account only the (Poisson)
uncertainties
in
  gal;
the y range of the box 0.3 < npk < 2.5
is
also an approximately 68% interval on the number density of similar
structures at
z
  3, based on the fact that we have detected one such overdensity in the
first densely sampled field. The two smooth curves for each cosmology
give
an idea of the uncertainty in npk. The upper curve
applies if the true mass of the structure is 1
 lower than our best estimate and the
normalization
 8
is 1
 higher
than the best estimate of Eke,
Cole, &
Frenk (1996). The lower curve applies if the mass of the structure
is
1
  higher and the normalization is 1
 lower than the best estimates. See text.

 Redshift
histogram of the 67 color-selected objects with z > 2 that
have been
confirmed spectroscopically in
an 8
 7
by
17
 6
strip. The dotted curve represents the smoothed redshift selection
function
obtained to date for our overall survey, normalized so as to have the
same
number of total galaxies as the SSA 22 sample. Approximately one-third
of
the confirmed redshifts are from the SSA 22 fields. The binning here is
arbitrary; the formal boundaries of any "features" in the redshift
distribution used for analysis were obtained using the method described
in §
3 and in the Appendix.
 Reconciling
the observed galaxy overdensity with various cosmological scenarios.
The
smooth curves show the expected number of peaks in this field with
linear
overdensity greater
than
  L.
The shaded boxes show the approximate peak height and number density
deduced from our observations. The actual box position is slightly
different for each of the cosmologies, but this difference is
insignificant
for our purposes. If a curve passes through the box, then the
corresponding
parameter values are at least roughly consistent with the existence of
the
spike in the redshift histogram. The x range of the box is a
68%
confidence interval that takes into account only the (Poisson)
uncertainties
in
  gal;
the y range of the box 0.3 < npk < 2.5
is
also an approximately 68% interval on the number density of similar
structures at
z
  3, based on the fact that we have detected one such overdensity in the
first densely sampled field. The two smooth curves for each cosmology
give
an idea of the uncertainty in npk. The upper curve
applies if the true mass of the structure is 1
 lower than our best estimate and the
normalization
 8
is 1
 higher
than the best estimate of Eke,
Cole, &
Frenk (1996). The lower curve applies if the mass of the structure
is
1
  higher and the normalization is 1
 lower than the best estimates. See text.