| As with the Milky Way, the surface brightness (flux per unit area) of spiral disks is described by an exponential law: | |
| Or, if we convert this to magnitudes per square arcsecond: | |
Note that while the observed brightnesses and sizes of galaxies drop at larger distances, surface brightness does not change. Look at a patch of the galaxy of fixed angular size, and imagine moving the galaxy to larger distance.
So we can measure the surface brightness of spiral
galaxies and learn immediately the luminosity density -- the density of starlight in Lsun/pc2 -- inside the galaxy without knowing the distance. Very useful! In the B filter, mu = 27 mag/arcsec2 corresponds to 1 Lsun/pc2. A galaxy with a surface brightness of muB = 22 mag/arcsec2 has a luminosity density of 100 Lsun/pc2.
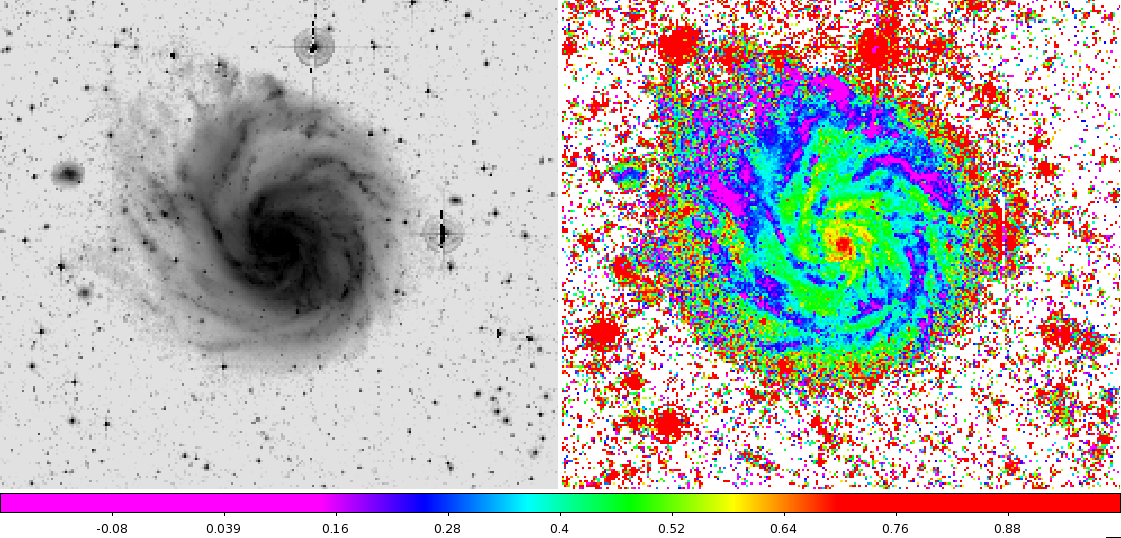
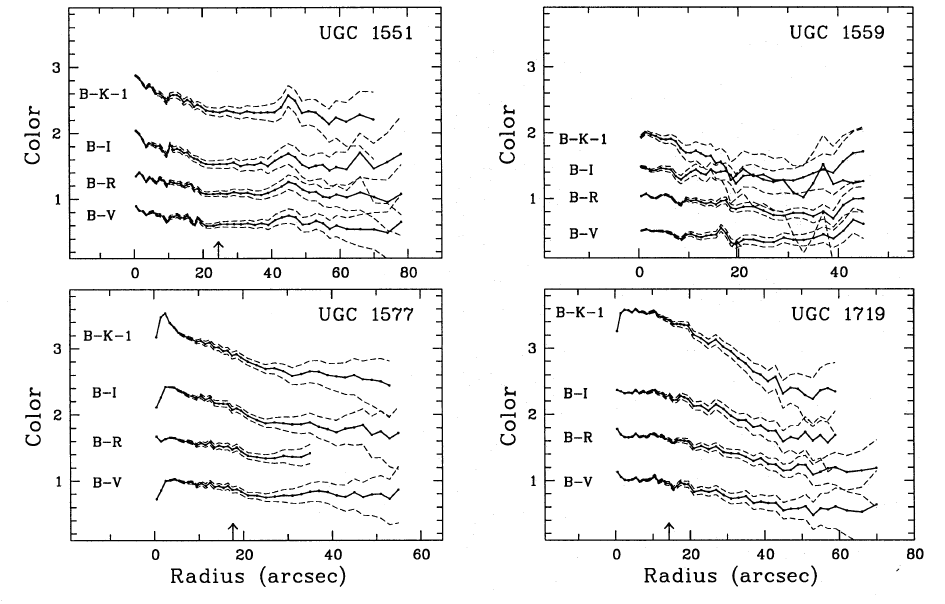
Galaxies show a wide range
in
central surface brightnesses; there is no preferred central
surface brightness. On the left is M101, a high surface brightness
galaxy;
on the right is Malin 1, a low surface brightness galaxy.
 |
 |
| Spiral galaxies typically show flat
rotation curves. Dark Matter!
The luminosity of a spiral galaxy correlates with its rotation velocity: the Tully-Fisher Relationship
|
 |
|
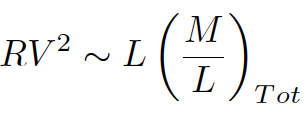
First, remember what
determines the circular
velocity:
|
 |
|
so that
|
|
|
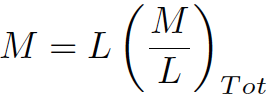
we don't know the mass of a
galaxy, but
we know its luminosity, so let's make up a quantity called the total mass-to-light
ratio (which includes everything: stars, gas, dark matter):
|
 |
|
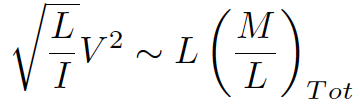
now remember that surface
brightness is
luminosity over area:
|
 |
|
or, solving for R:
|
 |
|
OK. Now, mass is mass:
|
|
|
so equate our two mass
expressions:
|
 |
|
substitute in for R:
|
 |
|
and solve for L:
|
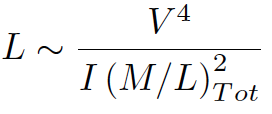 |
Whew! So Tully-Fisher works if surface brightness times total (not stellar) mass-to-light-ratio squared is constant. In other words, the stars and the dark matter are somehow linked.
Why would that be true?But this tells us something fundamental about how galaxies formed. Any model for galaxy formation must explain the Tully-Fisher relationship.
We don't understand it, but it seems to work!
OK, so let's look at the Tully-Fisher relationship
for
nearby galaxies using different wavelengths:
|
|
|
|
 X-axis: ~2Vcirc Y-axis: absolute B magnitude |
 X-axis: ~2Vcirc Y-axis: absolute R magnitude |
 X-axis: ~2Vcirc Y-axis: absolute H magnitude |
|
|
|
Question: Why would the relationship change
depending
on what wavelength you look at?
| Let's look at a different
version of the classic Tully-Fisher relationship: Blue luminosity
versus circular speed for a sample of spiral galaxies. We see the linear relationship, with a decent bit of scatter. |
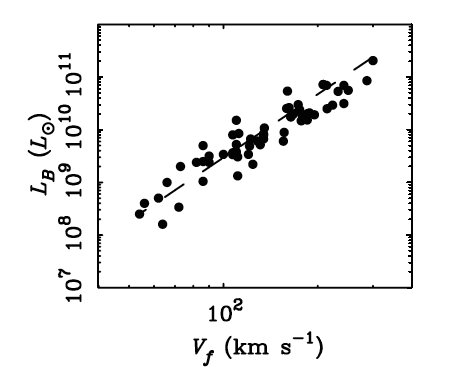 Blue luminosity (LB) versus circular speed (Vf)
|
| Now let's use the colors
and luminosities of the galaxies, along with stellar population models,
to work out the mass of all the stars in each galaxy. If we plot that
on a TF-like diagram, the scatter is much less for massive galaxies,
but the low mass galaxies don't fit. But there's more stuff than just stars in a galaxy -- we haven't accounted for gas. Low mass spirals are preferentially more gas-rich, so we are missing a lot of their mass. |
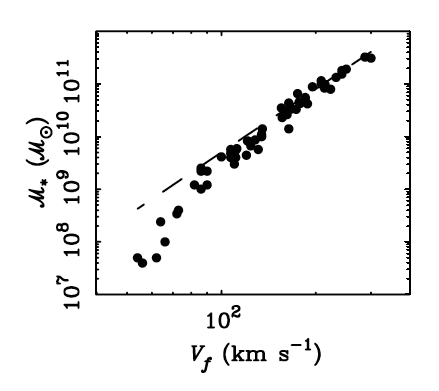 Stellar disk mass (M*) versus circular speed (Vf)
|
| If we define the total
baryonic mass of the galaxy by adding both stars and gas together, we
get any extremely tight relationship over orders of magnitude in mass! There is a basic, fundamental relationship between the amount of normal (baryonic) mass in a spiral galaxy and the speed at which they rotate. This is a huge constraint on models of dark matter and galaxy formation. |
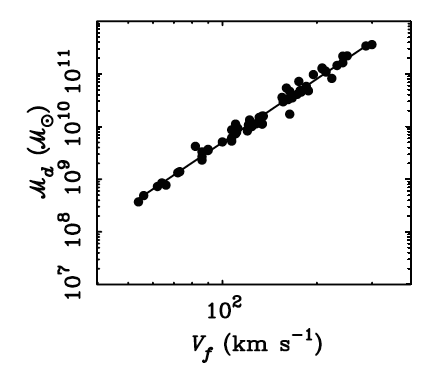 Baryonic disk mass (Md) versus circular speed (Vf)
|