Using Supernovae to Study Cosmology
The Redshift-Distance Test
As a function of redshift, the apparent magnitude of distant objects changes under different cosmologies, for two reasons:
- The shape of space determines how photons spread out as they move outwards (the classic 1/d2 effect)
- The expansion history determines how the photons are redshifted.
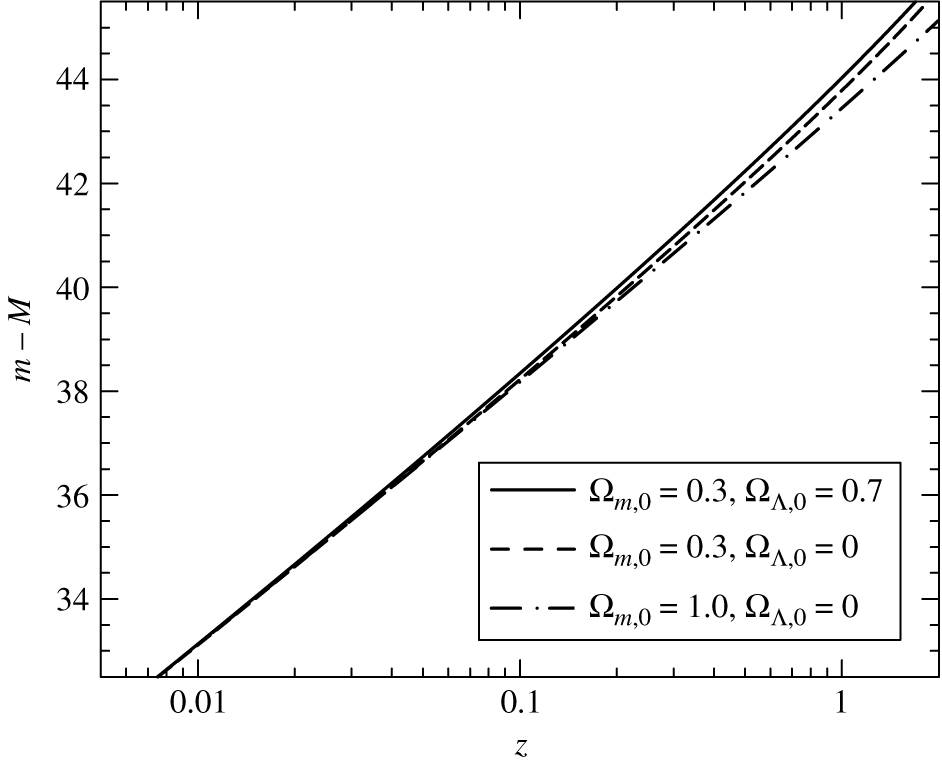
This can be worked out under different cosmologies to derive a form akin to our regular magnitude-distance expression:
m-M = 5logdL(z) -5
where dL(z) is the luminosity distance,
and depends on H0, OmegaM, OmegaL, and k. We typically plot this using
the distance modulus, not the distance, though (from Carroll and
Ostlie):
If we had an object of fixed brightness -- a standard candle -- we
could plot its apparent magnitude as a function of distance and work
out the cosmology.
Remember Type Ia supernovae:
the explosion of a ~ 1.4 Msun white dwarf. These are pretty good
approximations to a standard candle, and they are extremely bright.
That's
exactly
what we want to use for the redshift-distance test.
But are SN Ia's
really
standard candles?
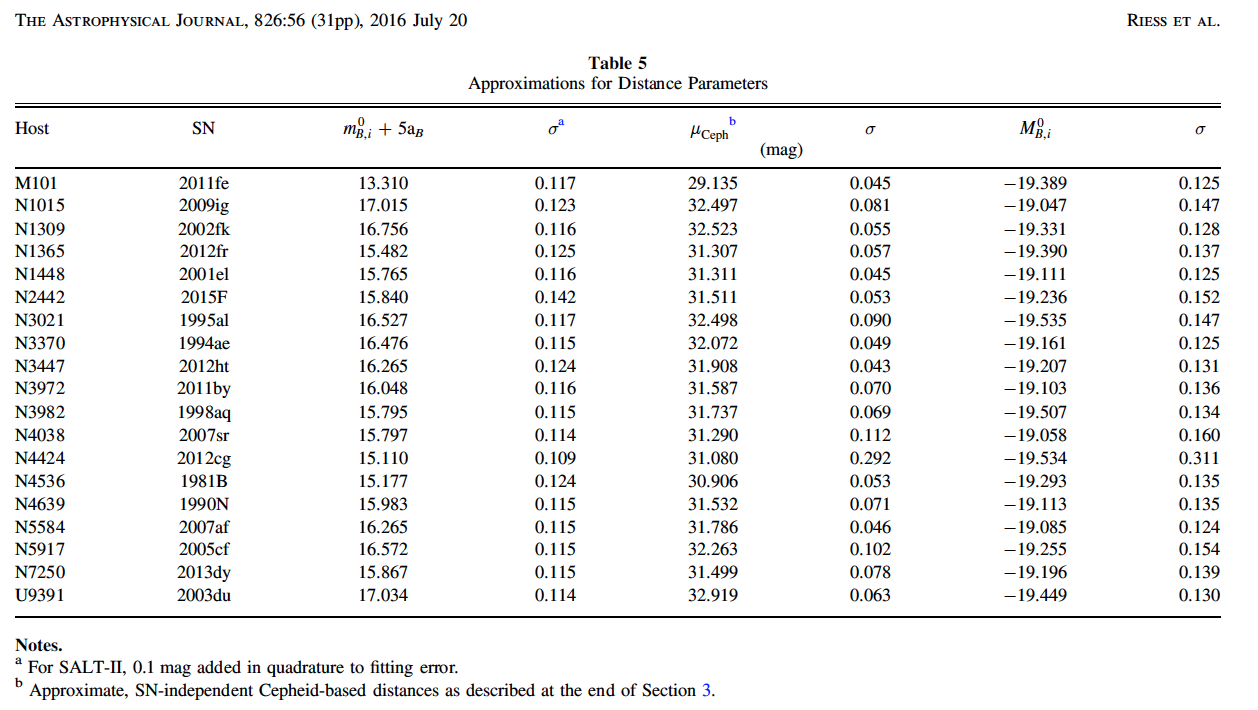
Type Ia supernovae in galaxies w/ Cepheid distances (From Riess etal 2016):

Which gives an average peak absolute magnitude of -19.26 +/- 0.16.
This uncertainty in peak mag includes the distance
uncertainties to the galaxies, so the real dispersion in peak magnitude
is even smaller, about 0.1 mags or so. That's a pretty good standard
candle.
But there's a significant drawback to using Type Ia
SNe.
You
gotta find them...
Using supernovae to study cosmology
-
Take a BIG picture of the sky.
-
Come back next month and take the same picture.
-
Compare the two. Differences?
-
If you find a possible supernova, take a spectrum
of it and
make sure it is a Type Ia SNe.
-
Also take a spectrum of the galaxy it lives in, to
find its
redshift.
-
Watch the supernova as it fades, so we can get its
peak apparent
magnitude. This is important -- you probably didn't catch it when it
was
at its peak, so we need to fit it to a standard light curve to derive
its
peak magnitude.
-
Keep doing this so you have a big sample of high
redshift
supernovae. Then compare those supernovae to ones at lower redshift.
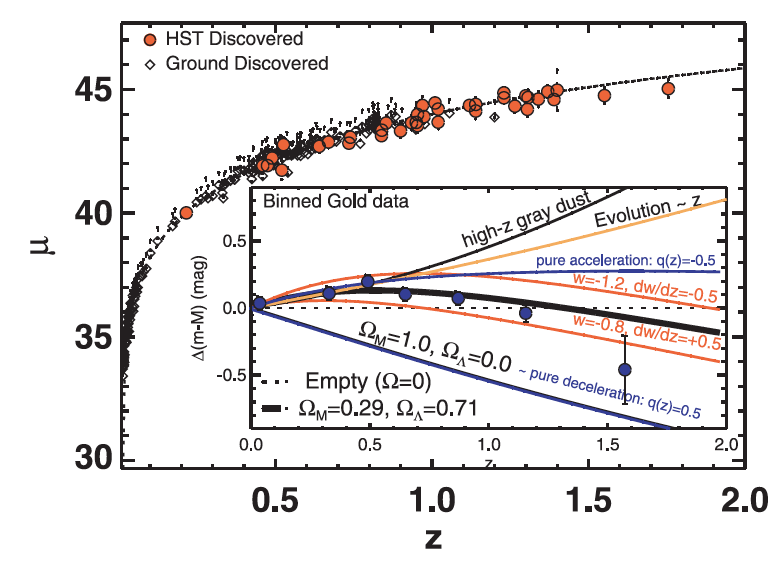
Some plots, courtesy of the supernovae
cosmology project at LBL and the high
z supernova search team at CfA:
More recent data: HST discovered supernovae, extending to higher redshift (Riess et al 2007).
In this plot mu=m-M, the distance modulus. Curvature in the data is inconsistent with models
that use dust or evolution to explain faintness of high-z SNe; instead
it is indicative of the "jerk" in the expansion history when lambda
began to dominate and the universe went from decelerating to
accelerating.


